The month of Ramadan is the busiest time of the year in Malaysia for just about anybody and the advertising industry is not excluded from this hustle. Typically, the Nuffnang team would gear their conversations with collaborators and clients to highlight the Muhibah spirit, quick recipe hacks that will impress your guests or stories of our Malaysian unity behind this joyous festival.
Then this year (2020), we are put into this ‘unique’ time of lives with COVID-19 impacting our world and unforgivingly, our celebrations as well. Perhaps, you find that brands are reconsidering their plans for Ramadan activations; and questions now arise on how effective campaigns would be amongst the flood of noise lead by COVID-19 updates and the nagging assumption that any interests toward celebrations are taking a backseat. Naturally, our pals in the advertising and marketing teams start to wonder how they can best justify the effectiveness of their Ramadan plans.

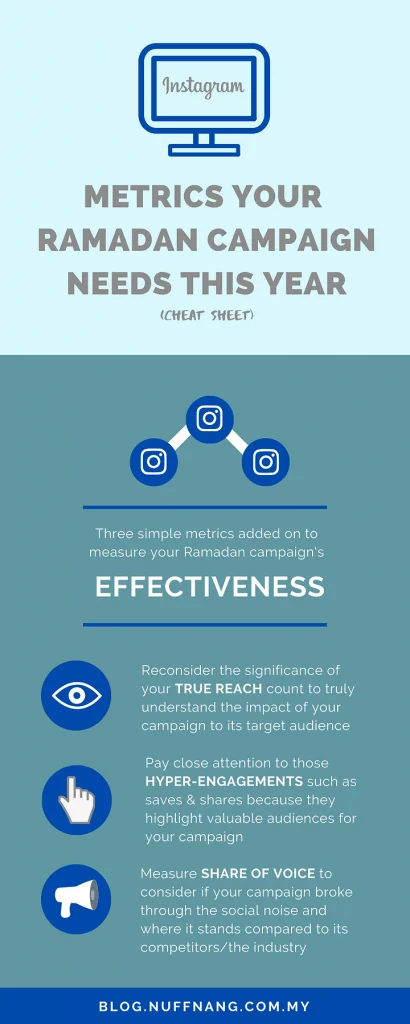
Worry not, we’ve got you a cheat sheet!
To help you out, we have compiled a list of metrics on what we find would best assist you in understanding the effectiveness of your Ramadan campaign despite all the noise that happens during Ramadan and more.
1. A metric that is often overlooked & misunderstood, the true reach count.
In many of our KOL-driven campaigns, most of us will look for how many followers the KOL has or the collective following for the entire campaign.
Yet, what most failed to realised is that the number of followers, although plays a role in terms of reach, does not solely determine the success of the campaign.
Hence, we’ve also written on the significance of considering a KOL and your campaign’s true reach count in our other write up here in hopes of clearing the air. If true reach count is still a mystery to you, we would suggest a read of that article before we continue.
We have especially highlighted true reach count as an important metric to include in your Ramadan campaign because part of your campaign’s objective would surely be to evaluate the number of audiences that actually viewed your content and consequently, what were their reactions to it – did they like it, what were their sentiments, what did they do upon viewing the content, are there indications they are suffering from ad fatigue? All these questions hanging in the air and it all starts from evaluating the true reach count.
2. Focusing on ‘hyper-engagements‘, we’re obsessed!
As per the industry benchmark, we calculate engagement rates by taking into account all forms of engagement each piece of content generates – through views, likes, comments, shares, and saves.
However, we have always had a particular obsession with what we call ‘hyper-engagement’ here in Nuffnang. These are metrics such as comments, shares, and saves where audiences take the extra mile to indirectly communicate to the brands their enjoyment of the content.
‘Hyper-engagements’ elevates the effectiveness of a campaign because if you think about it, you would comment, share or save content for reasons such as
- You have something worth saying (and brands should be all ears to hear)
- You find the content worth sharing with your friends and family
- You want to go back to the content again in the future

In 2019, Nuffnang executed a Ramadan campaign for Nestlé Corn Flakes to showcase the product’s versatility by incorporating it into Raya recipes. To suit the campaign deliverables better, we engaged with recipe-sharing KOLs known for sharing local baking and/or cooking recipes. The contents were scheduled to live 3 weeks before Raya with each Alpha KOL’s content spaced weekly.
The result was an astounding performance with over 10,000+ audiences sharing the recipes among their peers and over 82,000+ save-actions indicating intent to return to the content. It surpassed the industry benchmark with 178% of the audiences engaging with the content on Instagram! With the engagement rate alone, we can easily conclude that the campaign was effective. However, going down deeper into the ‘hyper-engagements’ helps us to further uncover the exact impact of the content for the Nestlé Corn Flakes.
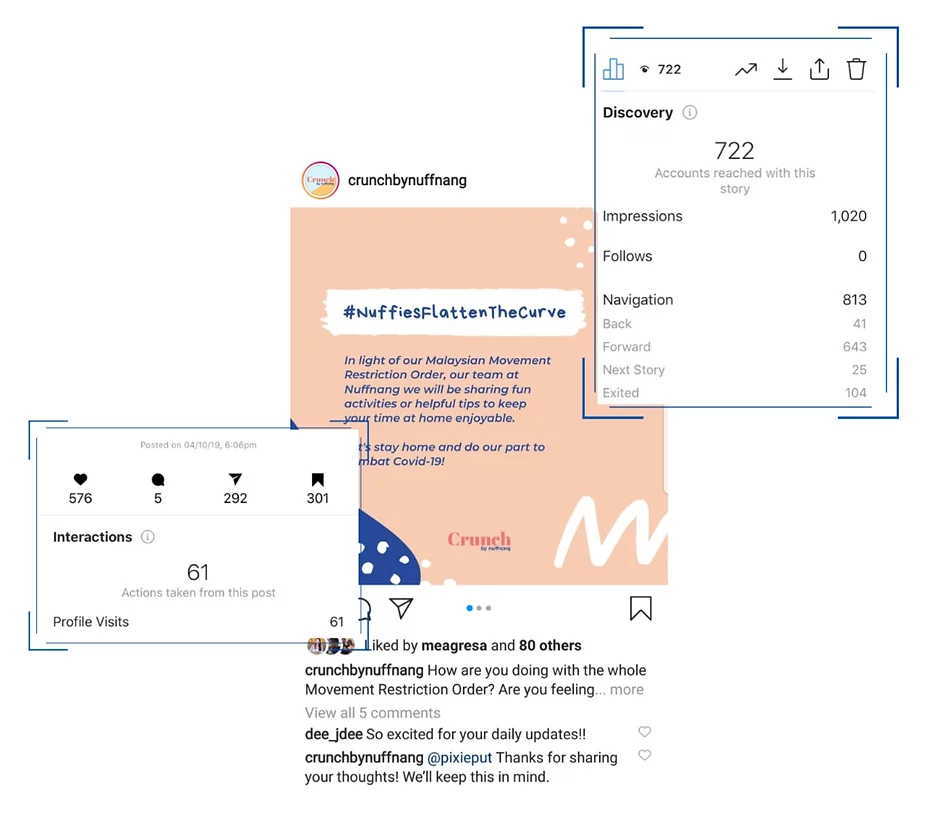
Another ‘hyper-engagement’ that is also missed out on is the Instagram Story navigations. The seemingly innocent navigation numbers can reveal to us the level of interest and engagement of the audience towards the Instagram Story content. More attention should be paid on the “back” navigation because it reveals the number of audiences who reversed and rewatched the content. This metric especially signifies that the audiences were interested enough with the content to reverse and review it again which elevates the campaign’s effectiveness.
Especially during Ramadan where there would undoubtedly be a flood of content released, you would want to understand your audience’s behaviour towards your content better – such as the percentage of engaged audience vs. those disinterested, their potential for conversion within the KOL’s profile – data you could clearly review to better evaluate your campaign effectiveness.
3. Tracking your campaign’s Share of Voice.
Why is it important for us to track the share of voice for a campaign?
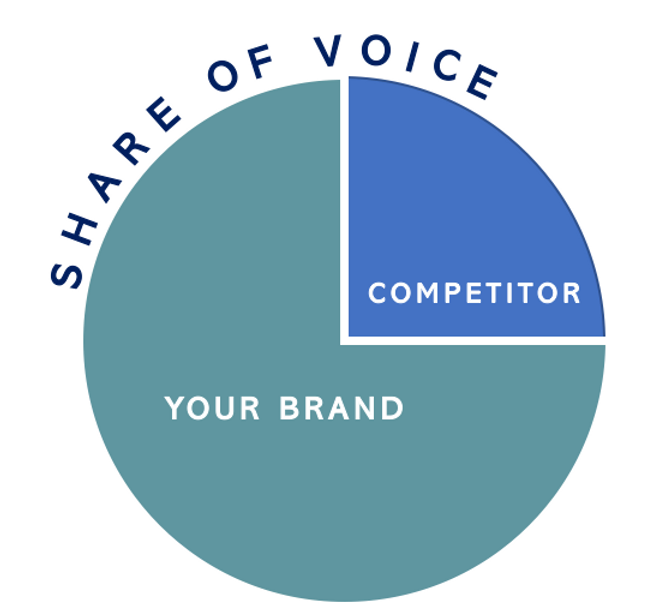
Share of Voice allows us to have an overview of the campaign’s impact on the audience. Especially throughout this Ramadan period, it is crucial to ensure that your brand does not get drowned out by all the noise happening on social media.
Through relevant keywords, Share of Voice scans the conversations happening on social media that surrounds your brand and reports it comparatively. With this, you’ll be able to find out who is making the most noise, what are the noise surrounding your brand that people are making, and even a sneak peek into your competitor’s activities.

Best case scenario, you are the louder brand compared to your competitor – congratulations! However, let’s just say you find that your share of voice percentage is lower instead, this insight gives you the opportunity to learn more about what works and what doesn’t. By using this metric you can also compare your share of voice as a brand with trending topics such as the COVID-19 pandemic. This is to evaluate how much of your brand was being mentioned online in spite of the pandemic that is happening and indicates how much your campaign impacted the public during these tough times.
Using the American Super Bowl as an example where Jeep debuted their 60-second commercial with Bill Murray to commemorate his 1993 film, “Groundhog Day”. The overlap of the Super Bowl and Groundhog Day (both on 2 February 2020) made the advertisement a prime example of how campaigns can leverage on existing trending themes to enhance their campaign share of voice. Prior to the big game, Jeep dropped hints of their advertisement on their social media platforms and generated buzz before the advertisement even aired. When everyone tuned in to watch the Super Bowl, the Jeep’s advertisement finally premiered. The advertisement received the highest share of voice from its audiences with over 16million online views and 168million social impressions – a number we see far exceeds the number of online streamers (excludes broadcasts) on Super Bowl LIV socials, with 7.4million (unique) streamers.
Ramadan during COVID-19 Pandemic
To wrap up, we in Nuffnang understands that we are all currently living in uncharted COVID-19 pandemic times. However, we also believe that we must do our best to stimulate ‘normal’ during such trying times; and Ramadan being a staple of Malaysian culture and heritage, helps to strengthen the revolve of the rakyat to see this pandemic through to the end.
Understandably, brands would also need to consider their economic benefits in working through these trying times with Malaysians. Hence, Nuffnang is calling out for you to consider including these metrics into your Ramadan activations to better evaluate your campaign effectiveness and moving forward, how to better optimise your budgets and strategies.
If you are interested in including these metrics into your future campaign’s Post Campaign Report, do contact your respective Nuffnang Operations and Analytics extraordinaire!